An In-depth Analysis into the 4% Rule
This article is the first in a series of articles on the 4% Rule. In this series I try to dive deep into the origin of the 4% ‘Rule‘ and further evaluate its validity using a few modern techniques and see what the implications are for your retirement planning. This is going to be a bit of an academic article series, so grab your favorite beverage of choice…i’ll wait.
What is the 4% Rule?
Before we get into the details of the 4% rule, let me define some of the terms that will be useful in better understanding this topic.
Retirement – A state in which the Retiree does not pursue working for the sake of paying the Bills
Passive Income – Income generated without working in a job or a business that requires any kind of effort input. Example: Interest Income on deposits, Dividend Income on Investments etc.
Retirement Portfolio – A collection of investments held by the Retiree in various forms like stocks, Bonds, Gold, Real Estate etc.
Withdrawal Rate – The Rate at which the Retiree takes out funds from their Retirement Portfolio to pay the bills during retirement. This Rate is usually expressed as a percentage of the Total Portfolio worth.
With most of the basic definitions out of the way let us now look at the 4% Rule.
A Brief History of the 4% Rule
The Bengen Study
The 4% rule is a relatively new concept. William Bengen published an article in the Journal of Financial Planning in 1994 which talked about the various possible withdrawal rates. His study found that a 4% withdrawal rate from a 50%Stocks and 50% Bonds ensured portfolio survival over a 30 year period. In fact, a portfolio of just 100% stocks survives for 25 years at 4% withdrawal rate and 50 years at 3% withdrawal rate.

Bengen followed a 50-year Rolling-Window approach for his calculations. This means his scenario window started at a given year and goes on for subsequent 50 years. The next window starts the year after the first and goes on for the next 50 years and so on.
For example, The starting year is 1926 so the ending year is 1976. So 1926-1976 is one scenario. The next scenario is 1927 – 1977 and so on.
For every scenario the actual returns of the stock market are used. One can immediately see that this is a simplistic study for several reasons. The primary reason being the use of not only the past data but the exact same sequence of data. Bengen further goes to make recommendations based on such a non-rigorous study which makes me very skeptical. I intend to address these issues in subsequent articles.
The Trinity Study
The Bengen Study is further backed by a 1998 study published in AAII – American Association of Individual Investors popularly known as the Trinity Study (the name of the University the authors were associated with). The methodology is similar to the Bengen Study in that it uses the similar rolling window methodology to calculate portfolio survival based on past data.
The study used a range of withdrawal rates 3% – 12% over different periods of withdrawal 15 – 30 Years. 5 Portfolio Buckets were used ranging from 100% Stocks to 100% Bonds and various combinations.
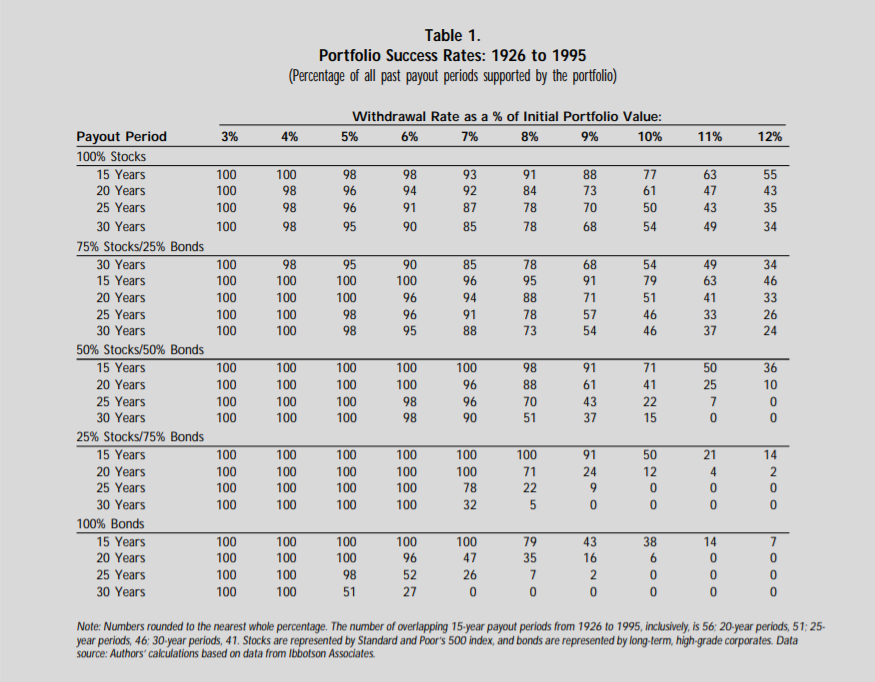
The numbers within the table indicate the percentage of the portfolios that survived. For example, look at the first row and first column of the above table, the number is 100. The column header is 3% while the row header is 15 years. The portfolio bucket used is 100% Stocks. This is how it is read – a 100% portfolio of Stocks with an annual withdrawal rate of 3% has survived for a minimum of 15 years in the past.
A quick scan of the table under the column header of 4% shows that regardless of the portfolio composition and the period (ranging from 15 years – 30 years) the survival rate is at least 98%
You can intuitively guess that the top left corner of the table has higher survival rates compared to the bottom right corner. The intuition being that the lower the withdrawal rates, the higher is the survival rate and vice-versa.
Another interesting note comparing the top right corner vs bottom right corner is that the portfolios of 100% stocks seems to over perform portfolio of 100% bonds at higher levels of withdrawal rates.
The above table does not take into account the Inflation. The table below shows the results after the withdrawals are corrected for inflation. You can see that the survival rate has come down but the overall pattern has remained intact.

The key recommendation from the Trinity study is to tailor the withdrawal rates according to the Retiree’s circumstances. The authors further guard their recommendations by suggesting to be flexible and not to treat the 4% ‘Rule’ as an annuity but more like point of reference from which to make any particular adjustments.
In their more recent update in 2011 update on the study the conclusions are largely similar with only minor nuances on the percentage asset allocations to stocks vs bonds.
Conclusion
The 4% Rule so to speak is based on a few research papers that are based on data analysis of historical returns. The FIRE community makes the mistake of treating it as a Rule per se whereas in reality it is just an expectation based on historic information. The 4% Rule is a statistical Model and like all statistical models, it is wrong but could be useful.
In the next article I try to challenge some of these studies and try to put forth a more rigorous analysis on this subject. Stay Tuned Folks!